One of the key topics in the field of technical analysis are support and resistance levels of securities. These are price ranges where the price, when rising from below has a higher likelihood to stop rising, fall back or consolidate in this range, which in this case is called a resistance level for security.
When such level is encountered from above, i.e. when the price is falling, then it can serve as a support level for the price. Which means that there is a higher likelihood that the price will stop falling, will bounce back again and start rising. Or that it will consolidate in this range for a while.
Support and resistance levels often occur at some major turning points where the price has a nice integer value, e.g. Ripple at 1 or Bitcoin at 50,000 USD. This is because the simple prices are often easier spotted as major turning points by traders and investors. Often when people set their stop losses they select as the stop losses the prices which are simple, like Ripple at 1. This then often leads to e.g. Ripple support and resistance levels being at 1.
One way to approach determining support and resistance levels is to use price and trading volume for that. One would assume that the intensity of given support and resistance levels is the more stronger, the longer the price is in a given price range and the greater is the trading volume realized in this range.
Here is an example of Ripple support and resistance levels computed in this way:
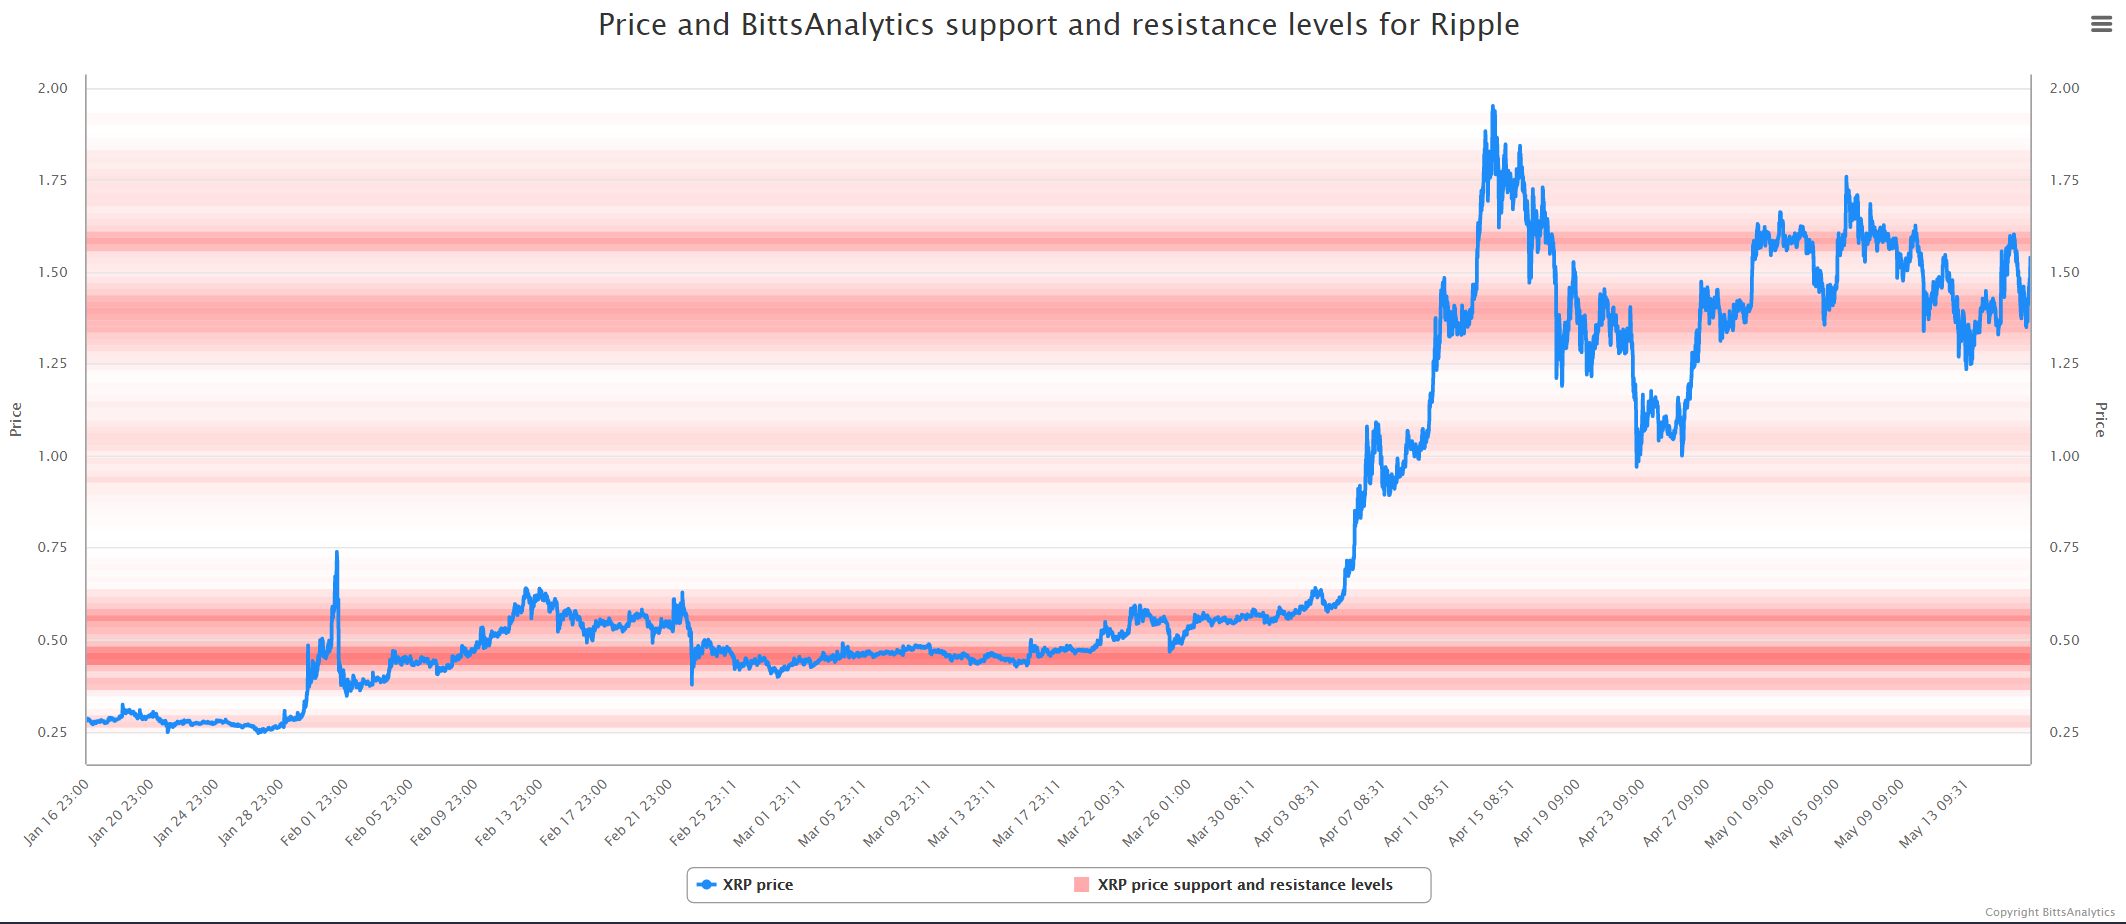
One can see that indeed the levels are the more intensive in those price ranges where the price has consolidated for longer times.